신체활동 수준이 심혈관계와 자율신경기능에 미치는 영향
Influence of Physical Activity Level on Cardiovascular and Autonomic Nerve Function
Article information

Trans Abstract
PURPOSE
The purpose of this study was to demonstrate differences in cardiovascular and autonomic nerve function among physical activity levels and associations between physical activity level and cardiovascular and autonomic nerve function.
METHODS
Sixty-six healthy young adults voluntarily participated in this cross-sectional study. Physical activity levels were assessed using triaxial accelerometers for 7 consecutive days. Central hemodynamics and arterial stiffness were measured using the Sphygomo-Cor Xcel system. Autonomic nerve function was assessed by heart rate variability.
RESULTS
The highest tertile group of the total quantity of physical activity had higher lnRMSSD than did the lowest tertile group (p=0.047). The augmentation index adjusted for heart rate at 75 beats per min (AIx@75) was lower in the highest tertile group of vig-orous-intensity physical activity than in the lowest tertile group (p=0.012). Moreover, AIx@75 was negatively associated with vigorous-intensity physical activity (r=-0.27, p=0.028).
CONCLUSIONS
High levels of physical activity contribute to the dominance of parasympathetic nerve activity at rest. Increased engagement in vigorous-intensity physical activity can help reduce arterial pulse wave reflection, an independent risk factor for cardiovascular diseases, even in healthy young adults.
서 론
심혈관계 질환은 전 세계적으로 가장 치명적인 사망원인이며, 유병률과 사망률이 꾸준히 증가하고 있다[1–3]. 심혈관계 질환의 위험요인으로는 수정이 불가능한 연령, 성별, 유전 및 인종 등과 수정이 가능한 혈압, 흡연 여부, 제 2형 당뇨, 콜레스테롤 수준 그리고 신체활동 부족 등을 들 수 있다[4,5]. 부족한 신체활동은 독립적으로 심혈관계 질환의 유병률을 증가시키며[4,5], 평소 신체활동 수준이 심혈관계 질환의 유병률과 부적 상관관계를 보이는 것이 이를 뒷받침한다[6]. 부가적으로 젊은 시절의 높은 신체활동량은 향후 중장년기 심혈관계 질환의 위험도를 낮추는 것으로 알려져 있다[6,7].
동맥경직도는 심혈관계 질환의 유병률 및 사망률을 예측할 수 있는 독립적인 인자이다[8]. 노화, 흡연, 비만, 신체활동 부족과 같은 다양한 요인들에 의해 동맥경직도가 증가되며[9–12], 동맥경직도 증가는 염증 물질 및 산화스트레스 발현 증가와 자율신경계의 불균형과 밀접한 관련이 있다[13,14]. 선행연구에 따르면, 다양한 집단에서 동맥경직도 수준과 심혈관계 질환의 위험요인 갯수 간 정적 상관관계가 나타났으며[15], 심지어 건강한 젊은 성인에게서도 동일한 결과가 도출되었다[12,15]. 이러한 결과는 중장년기와 노년기 심혈관계 질환의 유병률 감소를 위해 젊은 성인기부터 생활습관 교정을 통한 동맥경직도 관리가 필요하다는 것을 시사한다.
심박변이도는 비침습적으로 교감 및 부교감신경계 활동을 측정하여 자율신경의 조절 기능을 평가하는 임상 지표이며[16], 감소된 심박변이도는 자율신경계 불균형 및 기능 저하를 의미한다[17]. 안정 시 자율신경의 불균형은 상대적인 교감신경계 활동의 증가와 부교감신경계 활동의 감소로 유발되며[18], 이는 심혈관계 질환의 위험도를 증가시키는 요인 중 하나이다[9]. 또한, 자율신경의 불균형으로 인해 유발된 혈압 증가는 혈관 내 팽창압(distension pressure)을 높여 동맥경직도를 악화시킬 수 있다[10,14].
규칙적인 신체활동은 동맥경직도를 증가시키는 다양한 원인의 발생을 예방 및 지연시키며[19,20], 높은 신체활동 수준은 동맥경직도 감소와 연관성을 가진다[21]. 또한, 규칙적인 신체활동은 안정 시 교감신경계 활동 감소 및 부교감신경계 활동 증가를 야기하여 자율신경 균형 유지에 도움을 준다[22,23]. 따라서, 신체활동 참여는 직접적으로 동맥경직도의 감소와 자율신경계의 균형을 개선시키며, 신체활동으로 인한 안정 시 교감신경계 활동의 감소 및 부교감신경계 활동의 증가는 부가적으로 동맥경직도를 감소시킬 수 있다. 신체활동 수준에 따른 동맥경직도와 자율신경 기능의 관련성을 각각 규명한 선행연구는 존재하나[21,24–26], 세 가지 요인의 관련성을 평가하여 신체활동으로 인한 동맥경직도의 감소가 동맥경직도의 생리적 기전 중 하나인 자율신경 기능 향상과 연관이 있는지 평가할 필요가 있다. 또한, 다수의 선행연구들은 동작가속도계가 아닌 객관성이 부족한 설문지를 기반으로 신체활동 수준을 평가하였다[21,23,26]. 따라서, 본 연구의 목적은 3축 동작가속도계를 사용하여 객관적으로 측정된 신체활동 수준에 따라 동맥경직도 및 자율신경 기능에 차이가 나타나는지를 분석하고 앞선 세 가지 요인 간의 관련성이 존재하는지를 규명하는 것이다.
연구 방법
1 연구 대상
본 연구는 임상적으로 질환이 없는 건강한 20대 성인 66명을 모집하였다. 모집 대상자 중 심혈관계 및 자율신경계 기능에 영향을 미칠 수 있는 약물을 복용하는 대상자는 본 연구에서 제외되었다. 모든 연구참여자는 연구 목적과 절차에 대한 설명을 청취하고, 잠재적인 위험 및 주의사항에 대해 충분한 안내를 받은 후, 자발적으로 연구 참여 동의서를 작성 및 제출하였다. 본 연구는 인천대학교 기관윤리위원회의 심의 및 승인을 획득한 후 진행되었다(7007971-202008-002A).
연구참여자의 신체적 특징은 Table 1과 같다.

Participant characteristics and physical activity levels
2 연구절차
1) 연구 설계 및 절차
본 연구는 횡단적 연구 설계(cross-sectional design)를 적용하여, 총 신체활동량과 신체활동 강도별 참여시간에 따른 심혈관계와 자율신경계 기능의 차이 및 관련성을 분석하였다. 모든 연구참여자는 동의서 작성과 신체활동측정기 수령 그리고 심혈관계 및 자율신경계 기능을 측정하기 위해 총 2회 실험실에 방문하였다. 심혈관계 및 자율신경계 기능 측정에 영향을 미칠 수 있는 요인들을 통제하기 위해 측정 24시간 전부터 모든 연구참여자의 격렬한 신체활동 참여 및 알코올 섭취를 제한하였으며, 최소 12시간 전부터 공복을 유지하게끔 안내했다. 일주기리듬(circadian rhythm)이 측정변인에 미치는 영향을 통제하기 위해 모든 생리적 변인 측정은 오전 8시에서 10시 사이에 이루어졌다. 여성참여자의 경우 생리주기에 따른 여성호르몬의 혈중 농도가 혈관기능에 미치는 영향을 최소화하기 위해 체내 에스트로겐(estrogen)의 농도가 가장 낮은 초기 난포기(early follicular phase)에 모든 측정을 완료하였다.
2) 신장 및 신체구성
신장(cm)은 수동계측 신장계(삼화계기, Korea)를 이용하여 소수점 첫째 자리까지 측정하였다. 신체구성은 체성분 분석장비인 Inbody 720 (Biospace, Korea)을 사용하여 측정하였다. 신체구성 측정을 통해 연구참여자의 체중(kg), 골격근량(kg), 체지방량(kg), 체질량지수(kg/ m2), 체지방률(%)을 평가하였다.
3) 신체활동 수준
연구참여자의 신체활동 수준은 주말을 포함한 연속된 7일(평일 5일, 주말 2일) 간의 신체활동 데이터를 획득하여 분석 및 평가하였다. 신체활동 수준은 3축 동작가속도계(ActiGraph wGT3X-BT, ActiGraph, USA)를 사용하여 객관적으로 측정하였다. 연구자는 모든 연구참여자가 하루 중 샤워 또는 수중 활동을 제외한 모든 시간에 3축 동작가속도계를 착용하도록 하였으며, 정확한 측정을 위해 측정기간동안 엉덩뼈능선(iliac crest) 위 동일한 위치에 가속도계를 착용하도록 안내하였다. 총 신체활동량은 3축 동작가속도계를 착용하는 동안 감지된 움직임을 일평균으로 계산한 벡터 크기(vector magnitude; 수직축, 가로축, 세로축을 모두 고려한 벡터 값)를 사용하여 제시하였다. 신체활동 강도는 Freedson [27]이 제시한 기준에 따라 저강도 신체활동 시간(100-1,951 counts/min), 중강도 신체활동 시간(1,952-5,724 counts/ min) 그리고 고강도 신체활동 시간(5,725-9,498 counts/min)으로 분류, 적용하였다. 총 신체활동량 및 강도별 신체활동 시간에 따른 심혈관계 및 자율신경계 기능의 차이를 비교, 분석하기 위해 66명의 연구참여자를 신체활동 관련 변인들의 값에 기반하여 22명씩 상위, 중위 그리고 하위 그룹으로 분류하였다.
4) 심혈관계 기능
본 연구는 중심혈압 및 동맥경직도 지표인 맥파반사(pulse wave reflection)와 목동맥-넓다리동맥 맥파전달속도(carotid-femoral pulse wave velocity, cfPWV)를 평가하기 위해 SphygmoCor Xcel System (At-Cor medical, Australia)을 사용하였다. 측정 전 모든 연구참여자는 온도 및 조도가 조절된 실험실 내에서 최소 10분간 실험용 침대 위에 천장을 보고 누운 자세로 안정을 취하였다. 중심혈압 및 맥파반사를 평가하기 위해 연구참여자의 오른팔 위팔동맥의 맥파형을 압력커프를 통해 측정하였다. 측정된 위팔동맥의 맥파형은 SphygmoCor Xcel System 내에 내장된 수학적 변환 함수식을 통해 중심혈압과 맥파반사 관련 지표들로 산출되었다. 맥파반사 지표 중 맥파증대지수(augmentation index, AIx)는 심박수 변화에 의해 영향을 받기 때문에, 분당 75회의 심박수로 AIx를 보정한 값인 AIx@75를 다음의 계산식을 적용하여 추가적으로 산출하였다: AIx@75={-0.48×(75-안정 시 심박수)}+AIx. 중심혈압과 AIx는 연속된 측정치 간 차이가 각각 5 mmHg와 3% 이내인 2개 값의 평균으로 제시하였다. cfPWV는 중심동맥경직도를 평가하는 지표로서, 목동맥-넓다리동맥 간의 거리를 동일한 심장박동에 의해 형성된 두 지점간 맥파 생성 시간차로 나누어 산출되었다. 목동맥-넓다리동맥 간의 거리는 늘어나지 않는 줄자를 사용하여 목아래패임-목동맥(A), 목아래패임-넓다리혈압커프(B), 넓다리동맥-넓다리혈압커프(C)의 길이를 측정한 후 각 값을 B-(A+C)식에 대입하여 산출하였다. 두 동맥지점에서 동일한 심장박동에 의해 생성된 맥파의 시간차를 산출하기 위해 연필형태의 applanation tonometry probe를 사용하여 목동맥 맥파를 숙련된 연구자가 직접 측정하였으며, 동시에 넓다리동맥의 맥파는 연구참여자의 오른쪽 넓다리에 착용된 압력커프에 의해 감지되었다. cfPWV는 연속된 측정치 간 차이가 0.3 m/s 이내인 2개 값의 평균으로 제시하였다.
5) 자율신경 기능
자율신경 기능은 QHRV HW10A (Vital Scan, USA)를 사용하여 측정된 심박변이도에 의해 평가되었다. 심박변이도는 3-lead ECG와 호흡센서를 사용하여 측정하였으며, 내장된 소프트웨어를 통해 시간 영역과 주파수 영역으로 대변되는 자율신경 기능 관련 지표들을 산출하였다. 본 연구에서는 심박변이도의 시간 영역 지표로 RR interval의 표준 편차(SDNN)와 연속적인 RR-interval의 평균 제곱 제곱근(RMSSD)을 사용하였다. 심박변이도의 주파수 영역 지표는 저주파 영역대 파워(low-frequency power, LF; 0.04-0.15 Hz), 고주파 영역대 파워(high-frequency power, HF; 0.15-0.40 Hz) 그리고 저주파 영역대와 고주파 영역대 파워의 비율(LF/HF)을 사용하였다. 위에서 언급된 시간 및 주파수 영역 지표 중 SDNN과 RMSSD, HF는 안정 시 부교감신경계의 활성도를 반영하며, 심혈관계의 유병률 및 사망률과 밀접한 관련이 있다[25,26]. 부가적으로 LF는 교감신경계의 활성도를 반영하며, LF/HF는 교감신경계와 부교감신경계 간 활성 비율로 자율신경계의 균형을 의미한다[27].
3 자료처리방법
본 연구의 통계적 자료 분석을 위해 Window용 SPSS version 25 (SPSS Inc., IBM, USA)를 사용하였다. 모든 데이터는 평균과 표준오차(mean ±SE) 값을 사용하여 제시하였다. 통계처리를 위해 정규성이 위반된 자율신경 기능 지표들은 자연로그 치환을 하여 분석하였다. 총 신체활동량과 강도별 신체활동 시간에 따라 분류된 세 그룹 간의 심혈관계 및 자율신경 기능을 비교, 분석하기 위해 일원분산분석(one-way analysis of variance)을 실시하였다. 통계적으로 유의한 일원분산분석 결과가 나타난 경우, Bonferroni test를 통해 사후검정을 실시하였다. 총 신체활동량 및 강도별 신체활동 시간과 심혈관계 및 자율신경 기능의 관련성은 Pearson’ s correlation 분석을 통해 평가하였다. 모든 통계적 유의수준(α)은 5%로 설정하였다.
연구 결과
1 연구참여자의 신체활동 수준 및 신체활동 수준에 따른 신체구성의 차이
모든 연구참여자의 총 신체활동량의 평균 값은 427.0±15.8 counts/ min이었으며, 자세한 신체활동 강도별 참여시간은 Table 1과 같다.
총 신체활동량에 따른 세 그룹별 신체구성에는 차이가 나타나지 않았다. 하지만, 고강도 신체활동 시간이 적은 하위 그룹의 골격근량과 BMI가 상위 그룹보다 유의하게 낮았다(26.5±1.5 vs. 34.4±1.2 kg, p = .001; 22.4±0.8 vs. 0.4±24.7 kg/m2, p =.04; Table 2). 또한, 중고강도 신체활동 참여시간이 적은 하위 그룹의 골격근량이 상위 그룹보다 낮게 나타났다(27.9±1.4 vs. 34.3±1.2 kg; p =.006; Table 2).

Difference in body composition according toby physical activity intensity levels
2 총 신체활동량에 따른 그룹 간 심혈관계 및 자율신경 기능의 차이
연구참여자의 총 신체활동량이 가장 적은 하위 그룹보다 가장 높은 상위 그룹에서 이완기 혈압(brachial diastolic blood pressure, bDBP; 70.1±1.8 vs. 64.7±1.2 mmHg, p =.036; Table 3) 그리고 중심 평균동맥압(central mean arterial pressure, cMAP; 82.2±1.9 vs. 76.8±1.1 mmHg, p =.042; Table 3)이 유의하게 낮았다. 하지만, 동맥경직도 관련 지표에서는 총 신체활동량에 따른 그룹 간 유의한 차이가 나타나지 않았다(Table 3).
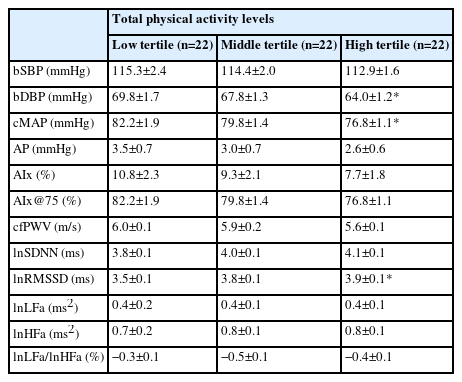
Differences in cardiovascular and autonomic nerve function according to total physical activity quantity
자율신경 기능 중 시간영역 지표인 lnRMSSD가 총 신체활동량이 가장 높은 상위 그룹에서 하위 그룹보다 유의하게 높았다(49.8±3.0 vs. 38.5±3.7 ms, p =.047; Table3, Fig. 1). 주파수 영역 지표들에서는 총 신체활동량에 따른 그룹 간 차이가 나타나지 않았다(Table 3).
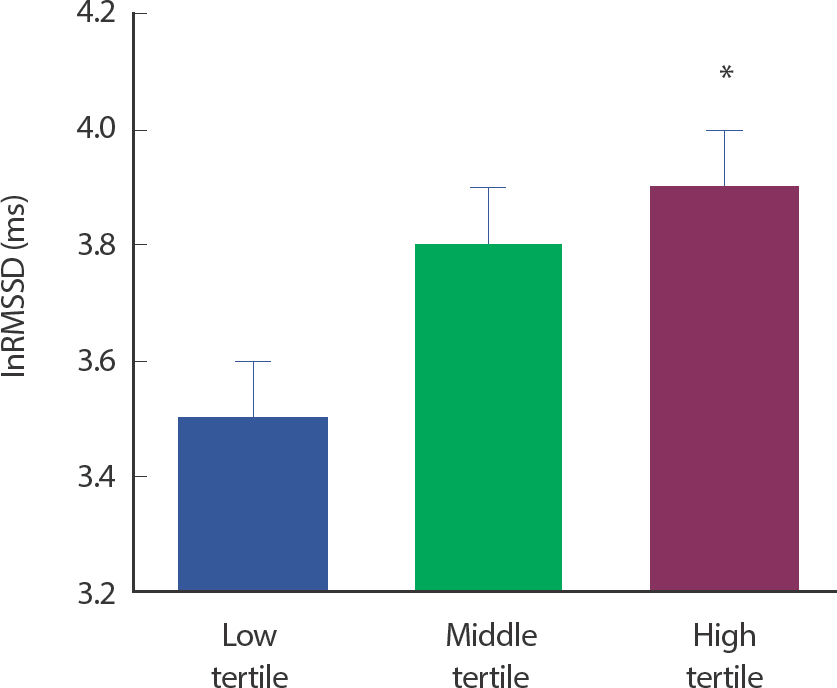
Difference in lnRMSSD according to total physical activity quantity. Values are mean±SE. lnRMSSD, root mean square of successive RR interval differences transformed by natural logarithm. * p<.05, Significant difference from the low tertile.
3 신체활동 강도별 참여시간에 따른 그룹 간 심혈관계 및 자율신경 기능의 차이
고강도 신체활동 참여시간이 가장 높은 상위 그룹의 AIx@75가 가장 적은 하위 그룹보다 유의하게 낮은 것으로 나타났다(−2.6±1.9 vs.6.1±2.1%, p =.012; Table 4, Fig. 2). 하지만 AIx 및 cfPWV는 고강도 신체활동 참여시간에 따른 그룹 간 차이가 나타나지 않았다. 또한, 다른 강도의 신체활동 참여시간에 따른 세 그룹 간 동맥경직도 지표의 차이는 나타나지 않았다(Table 4).

Differences in cardiovascular and autonomic nerve function according to physical activity intensity
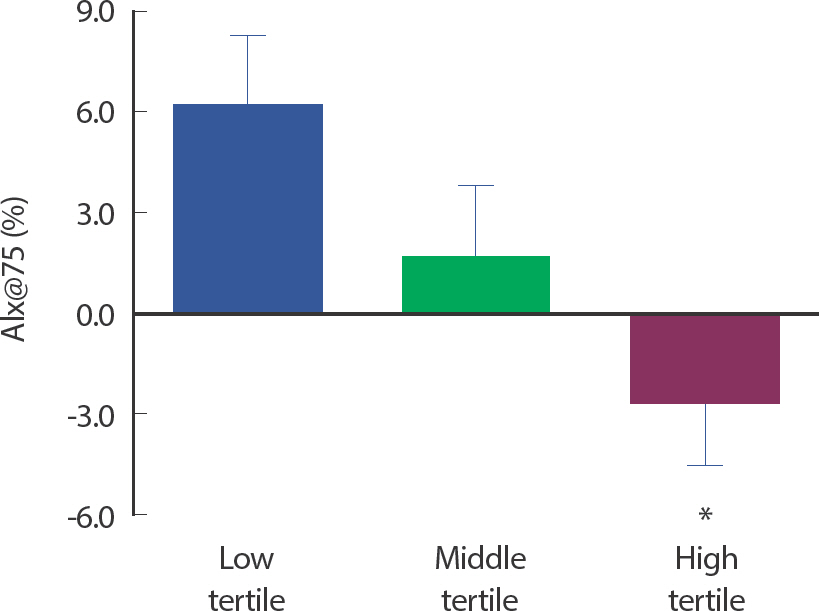
Differences in AIx@75 according to vigorous physical activity time. Values are mean±SE. AIx@75, augmentation index adjusted to heart rate at 75 beats/min. * p<.05, Significant difference from the low tertile.
자율신경 기능을 나타내는 시간 및 주파수 영역 지표들에서 저, 중, 고 그리고 중고강도 신체활동 참여시간에 따른 그룹 간 자율신경 기능의 유의한 차이는 나타나지 않았다. 신체활동 강도에 따른 그룹별 자율신경 기능에 대한 결과는 Table 4와 같다.
4 신체활동 수준과 심혈관계 및 자율신경 기능 간의 관련성
신체활동 수준과 심혈관계 지표들의 관련성을 분석한 결과, bDBP와 신체활동량 간의 부적 상관관계가 나타났다(r=−.25, p =.045; Table 5). 하지만, 총 신체활동량과 동맥경직도 및 자율신경 기능 간의 관련성은 나타나지 않았다. 각 신체활동 강도에 따른 참여시간과 심혈관계 및 자율신경 기능의 상관성을 분석한 결과, 고강도 신체활동 참여시간과 AIx@75는 부적 상관관계(r=−.27, p =.028; Table 5)가 나타났으며, lnSDNN과는 정적 상관관계를 보여주었다(r=.26, p =.039; Table 5). 자세한 총 신체활동량 및 신체활동 강도별 참여시간과 심혈관계 및 자율신경 기능 간의 관련성은 다음과 같다(Table 5).
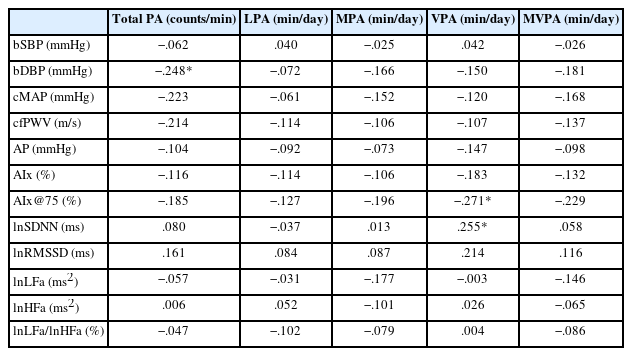
Correlation between physical activity level and cardiovascular and autonomic nerve function
논 의
본 연구는 젊은 성인을 대상으로 총 신체활동 수준 및 신체활동 강도별 참여시간에 따른 심혈관계 및 자율신경 기능의 차이와 관련성을 분석하였다. 신체활동 참여와 심혈관계 및 자율신경 기능 간의 관련성을 분석한 선행연구는 존재하나[28–30], 선행연구 대부분이 타당성이 낮은 설문지법을 통해 신체활동 수준을 평가하였다. 따라서, 본 연구에서는 타당성이 입증된 3축 동작가속도계를 사용하여 신체활동 수준을 측정하였다. 본 연구 결과, 총 신체활동량이 높은 상위 그룹의 안정 시 bDBP 그리고 cMAP가 하위 그룹보다 낮았으며, 부교감신경계의 지표인 lnRMSSD가 높게 나타났다. 또한, 총 신체활동량과 bDBP 간의 부적 상관관계가 나타났다. 신체활동 강도별 참여시간에 따른 분석 결과, 고강도 신체활동 참여시간이 높은 상위 그룹의 AIx@75가 하위 그룹보다 낮았으며, 고강도 신체활동량은 AIx@75와 부적 상관관계를, lnSDNN과는 정적 상관관계를 나타냈다.
총 신체활동량에 따른 그룹 간 심혈관계 기능의 차이를 분석한 결과, 총 신체활동량이 높은 상위 그룹의 안정 시 bDBP 그리고 cMAP가 하위 그룹보다 낮았으며, 총 신체활동량과 bDBP 간 부적 상관관계가 나타났다. 이러한 연구 결과는 신체활동량이 높은 상위 그룹의 혈압이 신체활동량이 적은 그룹의 혈압보다 유의하게 낮았다고 보고한 선행연구와 일치한다[31]. 신체활동 참여는 교감신경계 활동 감소와 부교감신경계 활동 증가를 유발하여 말초혈관 수축의 약화를 통해 혈압을 감소시킬 수 있다[32]. 본 연구에서도 총 신체활동량이 높은 상위 그룹의 미주신경계 매개 심박변이도를 반영하는 지표인 lnRMSSD가 하위 그룹보다 유의하게 높았으며, lnRMSSD와 bDBP 및 cMAP 간 부적 상관관계가 나타났다(r=−.36, p =.003; r=−.40, p =.001). 따라서, 총 신체활동량 증가로 인한 혈압의 감소는 부교감신경계의 활성화로 인해 나타난 것으로 사료된다.
본 연구에서는 총 신체활동량에 따른 그룹 간 동맥경직도의 차이와 총 신체활동량과 동맥경직도 간의 관련성이 나타나지 않았다. 이는 젊은 성인 및 청소년의 신체활동 수준과 동맥경직도 간 부적 상관관계를 보고한 선행연구 결과와 상이함을 보여준다[24,25]. 비슷한 연구참여자의 연령에도 불구하고 나타난 연구 결과의 차이는, 연구참여자의 신체적 특성, 연구참여자가 참여한 신체활동 종류 및 강도별 참여시간 차이 그리고 연구참여자의 성별 비율의 차이에 의해 나타난 것으로 사료된다. 하지만, 본 연구에서 고강도 신체활동 참여시간이 높은 상위 그룹의 AIx@75가 하위 그룹보다 유의하게 낮았으며, 고강도 신체활동 참여시간과 AIx@75 간 유의한 부적 상관관계가 나타났다. 이러한 결과는 고강도 신체활동 참여시간과 AIx@75 간 부적 상관관계를 보고한 선행연구 결과와 일치한다[33]. 더 나아가, 10대 때부터 30대 때까지의 신체활동 수준과 동맥경직도의 변화를 분석한 선행연구는 청소년기 말부터 30대 때까지 고강도 신체활동 참여시간이 높은 그룹의 동맥경직도가 참여시간이 적은 그룹보다 상대적으로 낮았다고 보고했다[34]. 이러한 결과들을 종합하였을 때, 젊은 성인의 동맥경직도 개선 및 감소를 위해서는 신체활동 참여 시 고강도 신체활동 참여시간을 증가시키는 것이 가장 효과적일 것이라고 예상된다.
총 신체활동량에 따른 그룹 간 자율신경계 기능을 비교하였을 때, 상위 그룹의 lnRMSSD가 하위 그룹보다 유의하게 높았다. 이는 젊은 성인의 총 신체활동량과 RMSSD 간의 정적 상관관계를 규명한 선행연구와 유사한 결과이다[26]. 또한, 본 연구에서 고강도 신체활동 참여시간과 lnSDNN 간 유의한 정적 상관관계가 나타났다. 이러한 자율신경 기능의 향상은 신체활동으로 인한 안지오텐신 II 발현 감소와 혈관내피세포 내 산화질소 생성 및 생이용률 증가로 인해 나타난 것으로 사료된다[35–37]. 일반적으로 안지오텐신 II는 부교감신경 내 수용체에 결합하여 부교감신경 활동을 억제시키며, 산화질소는 미주신경 활동을 증가시킴으로서 간접적으로 교감신경계를 억제한다[38,39]. 따라서, 젊은 성인의 규칙적인 신체활동 참여는 안지오텐신 II 감소와 산화질소 증가를 유발하여 부교감신경계의 활동 증가 및 자율신경 기능 향상에 도움을 주는 것으로 사료된다.
동맥경직도는 전신적 혹은 국소적인 산화스트레스와 염증으로 인한 혈관벽 구조의 변화, 혈관내피세포 기능 변화 및 자율신경 기능 변화에 영향을 받는다. 본 연구에서 젊은 성인의 동맥경직도와 자율신경 기능 간 유의한 상관관계가 나타나지 않았기 때문에 고강도 신체활동 참여시간에 따른 젊은 성인의 AIx@75 감소는 신체활동을 통한 혈관벽의 구조 및 혈관내피세포 기능의 변화로 인해 나타난 것으로 추정된다. 장기간의 규칙적인 신체활동은 혈관벽 구성물질인 콜라겐 감소와 탄성섬유 증가를 유발하며, 항산화물질과 항염증성 사이토카인을 증가시켜 동맥경직도를 감소시킬 수 있다[40–43]. 또한, 신체활동 참여는 혈관내피세포 기능을 향상시켜 혈관확장물질인 산화질소의 생성 및 생이용률을 증가시키고, 혈관수축물질을 감소시킴으로써 생리적, 화학적 자극에 대한 혈관벽의 반응을 개선시킨다[44,45]. 게다가, 고강도 신체활동 참여는 혈관내피세포 반응을 유발하는 생리적 자극인 전단응력(shear stress)를 증가시켜 저강도의 신체활동에 참여하는 것 보다 더 높은 산화질소 분비를 유발하여 혈관내피세포 기능 및 동맥경직도 반응에 긍정적인 영향을 미칠 수 있다[46]. 따라서, 비교적 동맥경직도가 낮은 건강한 젊은 성인일지라도 규칙적인 고강도 신체활동 참여는 동맥경직도를 감소시킬 수 있으며, 향후 연령 증가에 따른 동맥경직도 증가를 예방, 지연시키는 효과적인 행동중재가 될 수 있다.
결 론
본 연구는 임상적으로 건강한 젊은 성인의 신체활동 수준에 따른 심혈관계와 자율신경 기능의 차이 및 관련성을 규명하고자 하였다. 연구 결과, 고강도 신체활동 참여시간이 높은 젊은 성인이 낮은 동맥경직도를 보유한다는 것을 입증하였으며, 높은 수준의 총 신체활동량과 고강도 신체활동 참여시간이 자율 신경 기능 향상에 도움을 줄 수 있다는 것을 확인하였다. 하지만 본 연구는 신체활동 수준에 따른 산화스트레스 및 염증 물질, 혈관내피세포 기능, 자율신경 관련 기전을 추론, 암시하는데 한계가 있다. 또한, 본 연구에서 신체활동 수준 측정 시 연구참여자가 참여한 신체활동의 종류(유산소성 vs. 무산소성)를 정확히 평가할 수 없었다. 따라서 후속 연구에서는 관련 생리적 기전을 규명하는 연구가 필수적이며, 참여 신체활동 종류에 따른 젊은 성인의 심혈관계 및 자율신경 기능을 비교, 분석하는 연구도 필요하다고 사료된다.
Notes
이 논문 작성에 있어서 어떠한 조직으로부터 재정을 포함한 일체의 지원을 받지 않았으며, 논문에 영향을 미칠 수 있는 어떠한 관계도 없 음을 밝힌다.
AUTHOR CONTRIBUTION
Conceptualization: JS Kim, S Lee, MH Hwang; Data curation: SY Park, JS Kim, S Lee, R Lee, EY Lee; Formal analysis: SY Park, JS Kim, MH Hwang; Funding acquisition: MH Hwang; Methodology: SY Park, JS Kim, S Lee, R Lee, EY Lee, MH Hwang; Project administration: JS Kim, S Lee, MH Hwang; Visualization: SY Park, JS Kim, MH Hwang; Writing - original draft: SY Park, JS Kim; Writing - review & editing: JS Kim, MH Hwang.