Regional Differences in the Influence of COVID-19 Pandemic on Physical Activity Among Chinese Adults: A Social-Ecological Perspective
Article information

Abstract
PURPOSE
Physical activity confers benefits by mitigating the adverse physical and mental effects of coronavirus disease 2019 (COVID-19). Nevertheless, during a public health crisis, in which group-based physical activity is restricted, participation in such activities may be influenced not only by social distancing policies, but also by individual and environmental factors. As such, this study adopted a socio-ecological perspective to explore the impact of multidimensional factors on physical activity across diverse regions during the COVID-19 pandemic.
METHODS
Cross-sectional data from the 2021 Chinese General Social Survey (CGSS) were used. A total of 8148 respondents from 12 provinces and metropolitan cities were pooled. Two types of physical activity (walking and moderate-to-vigorous exercise) were included in the statistical tests. A three-step hierarchical regression analysis was used to analyze the incremental predictive power of factors related to intrapersonal, interpersonal and community resources for physical activity.
RESULTS
Findings highlighted the significance of intrapersonal (e.g., age, sex, socio-economic status, health status, and household registration area), interpersonal (e.g., neighborhood help and friendship), and community (e.g., exercise facility, fresh food accessibility, public facility, and residential safety) resources. These factors were significantly associated with Chinese adults’ participation in physical activity across various regions.
CONCLUSIONS
Findings of this study provide an initial validation of the socio-ecological approach to studying physical activity during the COVID-19 pandemic, suggesting that strategies aimed at promoting the benefits of exercise should include multiple factors that influence the likelihood of Chinese adults engaging in physical activity.
INTRODUCTION
Coronavirus disease 19 (COVID-19) remains a persistent global health threat, spanning more than two years since its declaration as a public health emergency of international concern on 11 March 2020 by the World Health Organization [1]. While the pandemic continues to impact global health, studies have presented diverse findings on noncommunicable risk factors associated with COVID-19 outcomes. Among the most detrimental behaviors is physical inactivity [2,3]. The rise of sedentary lifestyles, fueled by tech-nological advancements and transportation, has contributed to an increase in lifestyle-induced diseases, posing a significant economic burden globally [4]. In an effort to promote physical activity (PA), the WHO has endorsed a global action plan linked to the Sustainable Development Goals (SDGs) set for 2030 [5]. Unfortunately, the pandemic has limited access to public parks and outdoor physical facilities due to restrictive measures such as home quarantine, social distancing, and suspension of social event [6]. Previews research has demonstrated a decrease in mobility, walking, and PA levels, accompanied by a significant rise in sedentary behavior worldwide during the COVID-19 pandemic [7,8].
Scholars has developed a social-ecological model to comprehend the multifaceted determinants of PA [9]. This model underscores the dynamic interplay between contextual and personal factors rather than focusing exclusively focusing on singular determinants [10,11]. This makes it an ap-propriate model for investigating PA during the COVID-19 pandemic, ac-knowledging the multidimensional interplay between individual, interpersonal, community context, and public health policy. Previous research has demonstrated the effectiveness of the socio-ecological model in identi-fying multiple factors influencing PA in COVID-19 pandemic [12-14]. For example, one study reported that high levels of social support were linked to a 64% increased likelihood of sustaining PA [12]. The other study indicated that the impact of the COVID-19 pandemic on PA significantly de-pended on the living area. They observed a decrease in moderate-to-vig-orous physical activity (MVPA) in urban and urban-rural areas but not in rural areas [14].
Until December 2022, China had implemented relatively long and strin-gent measures compared to other Asian countries to prevent the COV-ID-19 pandemic, including lockdowns in the affected areas and quarantines for infected individuals [15]. Existing studies have shown that quarantine and social distancing have varying impacts on the participation in PA for different sub-populations in China [16-18]. For example, one study used data from a nationally representative social survey and found that social distancing during the COVID-19 pandemic significantly influenced the extent of PA among middle-aged to older Chinese residents, especially in Northeast or rural regions [18]. The other study reported that nearly 70% of Chinese residents had inadequate PA during the COVID-19 outbreak, but there was not significant correlation between insufficient PA and the infection rate of residents in each province [17]. In summary, while some studies have indicated a decrease in PA during the COVID-19 pandemic, regional differences in these changes are not clearly understood. Hence, the objective of this study is to utilize the socio-ecological model to investigate the connections between various levels of individual and environmental influences on participation in PA across different regions. Building on past research and gaps in empirical evidence, we hypothesize that the combined impact of social-ecological factors on participation in PA will vary by region in China.
METHODS
1. Participants
The research data consist of cross-sectional data from the 2021 Chinese General Social Survey (CGSS). The CGSS employed a multi-stage stratified sampling procedure, with counties serving as primary sampling units, urban communities and rural villages as secondary sampling units, and households randomly selected using a mapping sampling method [19]. The 2021 data of CGSS were publicly released in 2023, comprising 8,148 valid samples with a total of 700 variables. These variables include the A core module, B module, and C theme module, covering health related behaviors and comprehensive impact of the COVID-19 pandemic. The survey proj-ect spanned 5 months, and participants from 21 provinces (cities) were re-cruited. During the 2021 survey, approximately 33 percent of respondents (N=8,148) were randomly assigned to answer questions from the C theme module. For a detailed introduction to the CGSS2021 data, please refer to the China General Social Survey homepage (http://cgss.ruc.edu.cn/).
2. Measures
1) Dependent variables
PA consists of two items, including self-reported duration of walking (e.g., involving activities like commuting between work and home, walking for pleasure, exercise, or leisure) and MVPA (e.g., activities such as jogging, bicycling, exercise, carrying loads, manual labor, housework, etc.). For walking, participants were instructed to focus on workdays and choose “ how much time they spent walking”? The response options ranged from <15 minutes, 15-29 minutes, 30-59 minutes, 60-89 minutes to 90 minutes or more. Regarding MVPA, participants were asked to focus on every week and choose “ how much time they spent on activities that make them breathe harder than normal”? The response options ranged from never, <15 minutes, 15-29 minutes, 30-59 minutes, about one hour, about two hours, about three hours, about four hours, about five hours, to 6 hours or more. Following the guidelines for data processing and analysis of the International Physical Activity Questionnaire (IPAQ), ‘ sufficiently active’ is defined as either “3 sessions of vigorous activity lasting at least 20 minutes per day or 5 sessions of moderate-intensity activity or walking lasting at least 30 minutes per day” [20]. Considering this description, the walking and MVPA categories were combined to identify individuals who achieved any kind of moderate activity levels. Those reporting less than 30 minutes on weekdays were considered unlikely to achieve the recommended 30 minutes/day of ‘ sufficiently active’ and were designated as likely ‘ low active,’ while those reporting more than 60 minutes/day were likely ‘ high active’. Thus, walking and MVPA consists of three ordered categories: low, medium, and high, respectively.
2) Independent variables
In this study, age, gender, household registration area, health status, and subjective socio-economic status were utilized as intrapersonal variables. Age was treated as a continuous variable, ranging from 20 to 69 years old. Modern social scientists consider midlife as beginning around 35 to 40 [21]. Consequently, age was categorized into three groups: young (20-40 years old), middle-aged (41-60 years old), and older (61-80 years old). Gender and household registration were represented as dummy variables (“ fe-male”=0 and “ male”=1 for gender; “ rural”=0 and “ urban”=1 for household registration). Health status was measured using an ordinal scale (“ very unhealthy”=1 to “ very healthy”=5). Subjective socio-economic status was determined by the following question: think of this ladder as rep-resenting where people stand in your country. At the top of the ladder are the people who are the best off. At the bottom are the people who are the worst off. Considering the current society, your own socio-economic status is at “ upper layer”=5; “ upper-middle layer”=4; “ middle layer”=3; “ lower-middle layer”=2; “ lower layer”=1. Higher scores indicated a higher socio-economic status within the society.
According to the provided introduction, “ what I am asking below is the situation within one kilometer (about 15 minutes’ walk) around your community”, interpersonal resources were measured using a single scale with 2 items (α=.86) [22]. Responses for all items (e.g., “ The neighbors around me care about each other” and “ Neighbors are willing to help me when I need it”) ranged from “ very strongly disagree”=1 to “ very strongly agree”=5. Higher scores demoted higher levels of social support from neighbors. Community resources were evaluated using a single scale with 4 items (α=.59) [23]. Similar to the interpersonal resources scale, responses for all items (e.g., “ The place where I lives is suitable for physical exercise, such as jogging and walking”, “ There are adequate public facilities where I live, such as community centers, libraries, parks, etc.”, “ There are plenty of fresh vegetables and fruits to choose from where I live”, and “ Where I live is safe”) ranged from “ very strongly disagree”=1 to “ very strongly agree”=5. Higher scores in this context indicated increased levels of community resources for PA.
3. Statistical analysis
This study aims to investigate the combined impact of social-ecologi-cal factors on participation in PA for each region. To estimate the effect of socio-ecological factors on PA, three steps of hierarchical regression analyses were employed to analyze the incremental predictive power of 1. demographic characteristics: age, gender, socio-economic status, household registration area, and physical health status; 2. factors related to interpersonal resources: neighborhood support, and 3. community resources: neighborhood environment for PA. All statistical analyses were conducted using SPSS version 20.0.
RESULTS
The characteristics of the samples in this study are outlined in Table 1. Middle-aged adults (41-60 years) constituted 37.9% of the sample, fol-lowed by the elderly group (61-80 years) at 33.3%, and then the young adults (20-40 years) at 28.8%. Males accounted for 54.8% of the respondents, and 56.1% reported residing in urban areas. Considering the measures of the COVID-19 pandemic and characteristics of the survey areas in CGSS, the research regions were divided into four categories, the “ North” (Beijing, Hebei, Shanxi, Neimenggu, Liaoning), the “ East” (Ji-angsu, Zhejiang, Fujian, Shandong), the “ Middle” (Anhui, Jiangxi, Henan, Hubei, Hunan), and the “ West” (Guangxi, Chongqing, Shanxi, Gansu, Ningxia). Regarding residential regions, 29.7% of the respondents lived in the Middle areas, while only 21.3% resided in the North areas.

Descriptive statistics (controlled by age from 20-80)
Tables 2-5 present a series of three-step hierarchical multiple regressions conducted to predict participation in PA in each region during the COV-ID-19 pandemic. In the North region (Table 2), health status (β=.082, p<.1) emerged as a significant intrapersonal-level predictor, while public facility (β=-.074, p<.1) and residential safety (β=.139, p<.05) emerged as significant community-level predictors for MVPA. Both age (β=.087, p <.1) and household area (β=.193, p<.05) were identified as significant intrapersonal-level predictors for Walking. In the initial step, intrapersonal variables were introduced, elucidating that the five socio-demographic factors explained 2% of the variance for MVPA and 2.5% of the variance for walking. Moving to Step 2, two interpersonal variables (i.e., neighborly friendship and neighborly help) were incorporated into the regression equation. The resultant models explicated 2.9% of the variance for MVPA and 2.7% for walking. The adjusted R2 change from Step 1 to Step 2 was 1% for MVPA and 0.2% for walking. Finally, in Step 3, four community factors (i.e., exercise facility, fresh food accessibility, public facility, and residential safety) were integrated into the regression equation. These models explained 4.5% of the variance for MVPA and 3% for walking. The adjusted R2 change from Step 2 to Step 3 was 1.6% for MVPA and 0.3% for walking.

Hierarchical regression analysis predicting PA in North region areas

Hierarchical regression analysis predicting PA in East region areas
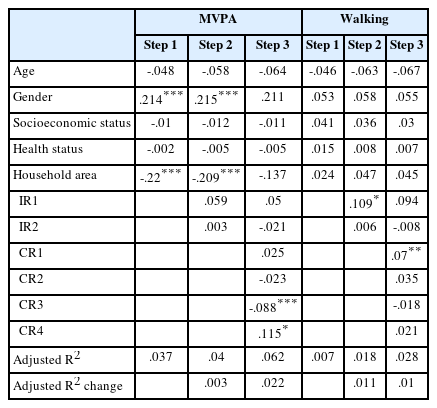
Hierarchical regression analysis predicting PA in Middle region areas

Hierarchical regression analysis predicting PA in West region areas
In the East region (Table 3), household area (β=-.169, p <.05) played a significant intrapersonal role, while neighborly help (β=.224, p <.01) emerged as an interpersonal-level significant predictor, and fresh food accessibility (β=.169, p <.01) played a significant community-level pre-dictor for MVPA. Household area (β=.129, p <.05) emerged as a significant intrapersonal predictor, and fresh food accessibility (β=.088, p <.1) played a significant community-level role for walking. In the initial step, intrapersonal variables were introduced, revealing that the five socio-de-mographic factors explained 2% of the variance for MVPA and 1.1% of the variance for walking. Progressing to Step 2, two interpersonal variables (i.e., neighborly friendship and neighborly help) were integrated into the regression equation. The resulting models explicated 4% of the variance for MVPA and 1.5% for walking. The adjusted R2 change from Step 1 to Step 2 was 2.4% for MVPA and 0.4% for walking. In Step 3, four community factors (i.e., exercise facility, fresh food accessibility, public facility, and residential safety) were incorporated into the regression equation. These models explained 5.9% of the variance for MVPA and 2.9% for walking. The adjusted R2 change from Step 2 to Step 3 was 0.4% for MVPA and 1.4% for walking.
For the Middle region (Table 4), both gender (β=.214, p<.01) and household area (β=-.22, p<.01) were identified as significant intrapersonal-level predictors, while public facility (β=.088, p<.01) and residential safety (β=.115, p<.1) emerged as significant community-level predictors for MVPA. Neighborly friendship (β=.109, p<.1) was identified as a significant interpersonal-level predictor, and exercise facility (β=.07, p<.05) played a significant community-level role for walking. In the initial step, intrapersonal variables were introduced, revealing that the five socio-demographic factors explained 3.7% of the variance for MVPA and 0.7% of the variance for walking. Progressing to Step 2, two interpersonal variables (i.e., neighborly friendship and neighborly help) were integrated into the regression equation. The resulting models explicated 4% of the variance for MVPA and 1.8% for walking. The adjusted R2 change from Step 1 to Step 2 was 0.3% for MVPA and 1.1% for walking. Finally, in Step 3, four community factors (i.e., exercise facility, fresh food accessibility, public facility, and residential safety) were incorporated into the regression equation. These models explained 6.2% of the variance for MVPA and 2.8% for walking. The adjusted R2 change from Step 2 to Step 3 was 2.2% for MVPA and 1% for walking.
For the West region (Table 5), gender (β=.142, p<.05), socio-economic status (β=-.163, p <.01), and household area (β=-.401, p <.01) were estab-lished as significant intrapersonal-level predictors, with public facility (β=.103, p<.01) playing a significant role for MVPA. Neighborly help (β=.163, p<.05) emerged as a significant interpersonal-level predictor, while both exercise facility (β=.067, p<.1) and residential safety (β=.135, p<.01) played a significant community-level roles for walking. In the initial step, intrapersonal variables were included, indicating that the five socio-demographic factors explained 10.1% of the variance for MVPA and 0.5% of the variance for walking. Progressing to Step 2, two interpersonal variables (i.e., neighborly friendship and neighborly help) were introduced into the regression equation. The resulting models elucidated 9.9% of the variance for MVPA and 1.8% for walking. The adjusted R2 change from Step 1 to Step 2 was 0.1% for MVPA and 1.3% for walking. Finally, in Step 3, four community factors (i.e., exercise facility, fresh food accessibility, public facility, and residential safety) were incorporated into the regression equation. These models explained 11.2% of the variance for MVPA and 3.8% for walking. The adjusted R2 change from Step 2 to Step 3 was 2% for MVPA and 2% for walking.
DISCUSSION
This study aims to investigate the relationships between various levels of individual and environmental factors influencing PA participation during COVID-19 pandemic across distinct regions using a social-ecological model. Based on relevant prior studies, we categorized the survey areas into North, East, Middle, and West, each characterized by differing levels of PA engagement and regional resources before and during COVID-19 pandemic. Before the pandemic, individuals in economically advanced regions in China (East & North) were found to be more actively engaged in physical activities compared to those in less economically developed regions (Middle & West) [24]. However, specific barriers (policy-related re-striction, administrative pressure, and institutional mechanisms) implemented during the pandemic impacted the availability and accessibility of public and sports facilities in various regions [25], potentially influencing PA participation in different areas. Research indicated that, despite having more exercise and public facilities, the East and North regions exhibit lower participation in MVPA compared to the West and Middle regions [26].
Our findings diverge from some prior studies conducted in China during COVID-19 pandemic. One study reported that levels of PA were more severely impacted in rural areas due to the lack of health-related knowledge and lower levels of health literacy among the rural elderly population during the context of social distancing [18]. Another study found no significant difference in the insufficient rate of PA between urban and rural areas, as both faced common challenges such as the lack of exercise facilities during the social distancing period [17]. These studies either overlook the influential role of multidimensional factors on PA or neglect regional differences for individuals residing in rural areas. Consequently, the outcomes of this study offer a valuable contribution to comprehending the predictors of an individual's engagement in PA from a macroscopic viewpoint. Consistent with previous research, our findings reveal noteworthy disparities in impact of multidimensional factors on PA across different regions.
In the context of factors associated with intrapersonal resources, the findings indicate that gender, socio-economic status, health status, and household area are linked to involvement in MVPA among Chinese adults across diverse regions. Specifically, in the northern area, individuals with a high level of health status were more inclined to engage in MVPA, while in other regions those residing in rural areas demonstrated a higher likelihood of engagement in MVPA. These findings align with studies from other countries reporting a decrease in MVPA in urban areas but not in rural areas [14,27]. In comparison to the northern and eastern regions, males with a lower socio-economic status residing in the middle and western regions exhibited a greater propensity for MVPA. Regarding walking activity, in contrast to the middle and western regions, older individuals in northern and eastern urban areas were more likely to partake in walking activity. The results are pertinent to the characteristics of PA participation in rural and urban areas before and during COVID-19 pandemic. Given the dichotomous rural-urban structure in China, a unique inequality exists in the Chinese leisure context, wherein rural status is situ-ated in multiple disadvantaged conditions and is more like to encounter barriers when partake in physical exercise [28]. Specifically, rural women with lower socio-economic statuses exhibit the lowest participation in general leisure activities, whereas urban men with higher socio-economic statues exhibit the highest participation [28]. However, during the pandemic, exercise facilities in residential neighborhood were blocked in both rural and urban areas. Consequently, the MVPA and walking activity may not be solely related to leisure sphere but rather may be associated with vo-cational and family life. In comparison with the North and East area, individual residing in the Middle and West regions are more likely to engage in bule-collar jobs, which involve more physical exertion. Meanwhile, older individuals in Northern and Eastern urban areas may have more op-portunity to walk to nearby market.
Our findings also underscore the significance of interpersonal resources, such as neighborly friendship and neighborly help, in influencing levels of PA among Chinese adults. Specifically, neighborly friendship contributes to increased participation in MVPA in the middle regions, while neighborly help enhances participation time in walking activity in both eastern and western regions. These results align with the perspective that social network for PA from neighbors and friends is likely to facilitate greater engagement PA [29,30].
Community-level factors were also demonstrated to be pivotal in influencing PA participation among Chinese adults in diverse regions. Specifically, residential safety and accessibility to fresh food contribute to increased participation in MVPA in the northern, middle, and eastern regions, while the availability of public facility is associated with a decrease in MVPA participation time in the northern, middle, and western regions. Similarly, fresh food accessibility and residential safety contribute to increased participation in walking activity in the eastern and western regions, while the availability of exercise facility enhances walking engagement in both middle and western areas. Consistent with previous studies conducted both in China and other countries, there is a re-curring pattern indicating that built environmental features and accessibility to PA facilities were associated with increased PA [13,31,32].
The study has certain limitations that should be acknowledged. Firstly, it employed a cross-sectional design relying on self-reported data. The inherent limitations of a cross-sectional approach restrict the ability to draw definitive conclusions regarding the causal relationships among multidimensional variables and participation in physical activities. Sec-ondly, the assessment of physical activities relied on a recall instrument, where participants reported the time spent per week in two activity do-mains. Consequently, the self-reported time allocation for walking and MVPA may be subject to limitations related to potential inaccuracies arising from memory recall.
CONCLUSIONS
This article delves into the public health implications of how diverse factors influence PA among populations across various regions during COVID-19 pandemic. To bridge existing knowledge gaps related to the nuanced roles of individual, social, and physical environmental attributes, we have structured this article within a social ecological framework. According to our statistical results, this study indicates that rural individuals residing in the eastern, middle, and western areas were more likely to partake in MVPA, while urban individuals residing in northern and eastern areas were more likely to partake in walking activities. Additionally, environmental factors such as social support and the availability of exercise facilities also demonstrated a significant impact on PA participation. The current study makes a significant contribution to the existing literature by elucidating the multidimensional effects on PA during the COVID-19 pandemic, utilizing the social-ecological model. Moreover, this research identifies regional variations in variables influencing PA in China. In light of these findings, it is recommended to proactively intervene in vulnera-ble groups during the COVID-19 pandemic, emphasizing the need for the implementation of a nationwide health promotion program.
Notes
No penitential conflict of interest relevant to this article was reported.
AUTHOR CONTRIBUTIONS
Conceptualization: C Nan, CG Kim; Data curation: C Nan; Formal analysis: C Nan; Methodology: C Nan; Project administration: CG Kim; Writing - original draft: C Nan; Writing - review & editing: C Nan, CG Kim.